
Metrics/KPIs - Live Dashboard
Introduction to ZIWO Live Dashboard Documentation
The ZIWO Live Dashboard is a powerful, real-time tool designed to provide actionable insights into your contact center’s performance. With a user-friendly interface and comprehensive data visualizations, the Live Dashboard offers an at-a-glance view of critical metrics that enable managers, supervisors, and team leads to monitor operations, make data-driven decisions, and optimize customer service processes.
This documentation provides a detailed overview of the Live Dashboard feature, highlighting key metrics, functionalities, and how they can be leveraged to improve your contact center's efficiency. By using the dashboard, users can track performance indicators such as call volume, agent status, wait times, and customer satisfaction, ensuring that the team remains responsive to changing conditions and can take immediate action where necessary.
With instant visibility into real-time performance, the ZIWO Live Dashboard allows businesses to stay on top of operational trends, improve customer experiences, and drive better results—empowering teams to work smarter and more efficiently. Whether you are monitoring KPIs, addressing issues in real-time, or planning for future growth, the Live Dashboard provides the tools and insights you need for optimal performance and sustained success.
In the following sections, we will explore the key features of the ZIWO Live Dashboard, the types of metrics it tracks, and how you can customize it to meet the unique needs of your business.
Live Dashboard is a feature Provides real-time or near real-time visualizations and updates of key metrics (KPI) and various parameters and information,( in other words, a real-time dashboard is a graphical user interface with a simple display that visualizes performance indicators and essential metrics crucial to the business).
Live dashboard provides:
- Visual Representation: display data in a visually appealing and easily digestible format, using visual elements.
- Instant Visibility: into current performance, allowing managers and supervisors for quick decision-making and the ability to respond promptly to changing conditions.
- Immediate Actionability: Live dashboards are valuable for identifying and addressing issues as they happen so it helps in data-driven decision making.
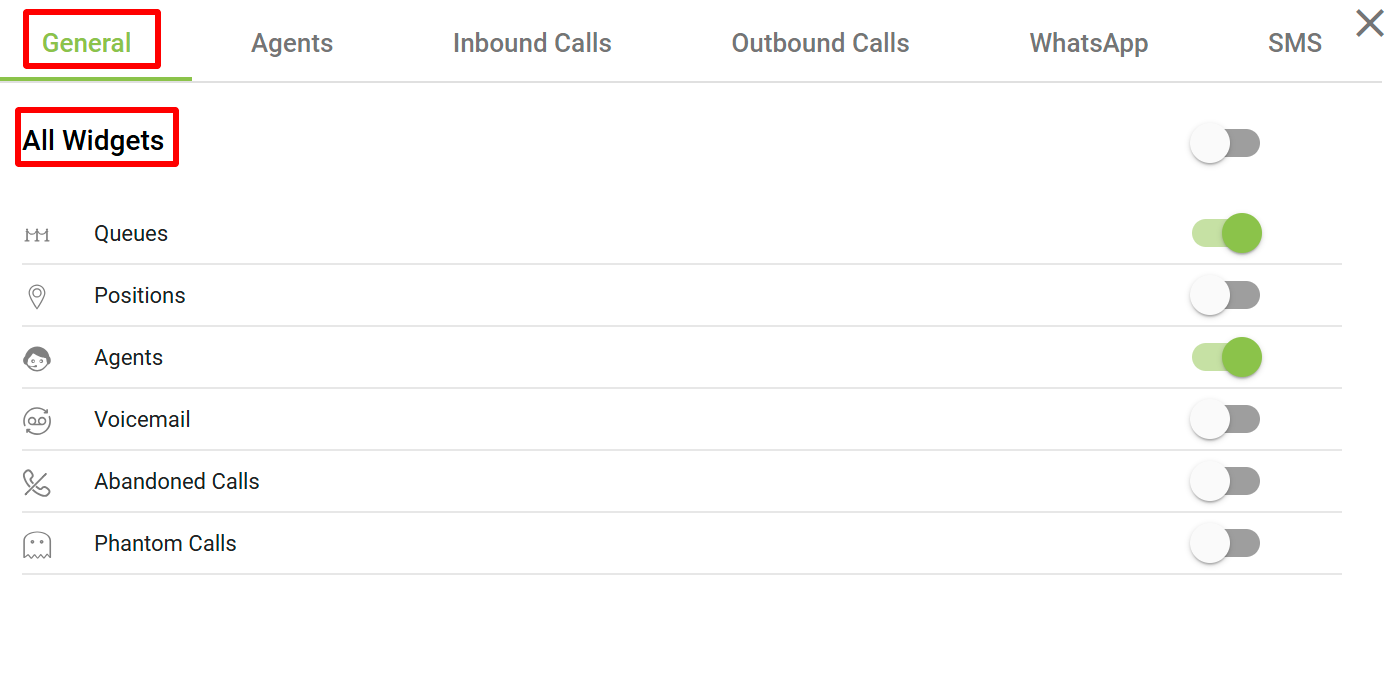
All Widgets
- Queues
- Positions
- Agents
- Voicemail
- Abandoned Calls
- Phantom Calls
Ziwo Live Dashboard Metrics: Detailed Overview
The Ziwo Live Dashboard provides an intuitive interface for managing and monitoring real-time metrics, offering insights into call center operations and agent performance. The following metrics/widgets are key features of the Ziwo Live Dashboard, helping businesses optimize their customer service processes:
1. Queues
Definition: A queue represents a virtual holding area where incoming calls are placed while waiting to be answered by an available agent.
Details:
- The Queues widget shows the status of different call queues in real-time. This allows managers to monitor how many calls are waiting to be answered, how long they've been waiting, and the status of each queue (active, idle, etc.).
- Metrics typically displayed for queues include:
- Calls Waiting: The number of calls currently in the queue.
- Average Wait Time: The average duration that calls have been waiting in the queue.
- Longest Wait Time: The call that has been in the queue the longest.
- Queue Size: Total number of calls in the queue.
- This widget helps ensure that queues don’t grow too large, enabling managers to optimize agent allocation and minimize wait times.
2. Positions
Definition: Positions refer to the number of available agents in a given state (such as available, busy, or offline) within a specific team or department.
Details:
- The Positions widget displays real-time information about the current status of agents, such as:
- Available Agents: The number of agents ready to take calls.
- On Call: The number of agents actively engaged in calls.
- Idle: Agents who are logged in but not currently handling a call.
- Offline: Agents who are not logged in or available for calls.
- In Wrap-up: Agents who are finishing a previous call (a post-call process).
- This data is essential for understanding workforce availability and ensuring there are enough agents to handle incoming call traffic efficiently.
3. Agents
Definition: The Agents widget provides a detailed overview of individual agent performance and activity within the call center.
Details:
- This widget displays metrics for each agent, including:
- Active Call Count: The number of calls an agent is currently handling.
- Average Handle Time (AHT): The average duration an agent spends on calls, including talk time and post-call wrap-up.
- Service Level: The percentage of calls answered within a specific timeframe (e.g., within 30 seconds).
- Calls Answered: Total number of calls answered by the agent during a given period.
- Calls Missed: The number of calls the agent failed to answer within the required time frame.
- Wrap-up Time: The time an agent spends after a call is completed, often used for note-taking or completing post-call tasks.
- This widget helps supervisors monitor agent efficiency, productivity, and adherence to service level agreements (SLAs).
4. Voicemail
Definition: The Voicemail widget tracks the number of calls that go to voicemail, providing insights into customer interactions that couldn’t be completed live.
Details:
- The Voicemail widget provides data on:
- Calls Routed to Voicemail: The number of incoming calls that were directed to voicemail due to agents being unavailable or busy.
- Voicemail Duration: The length of time the voicemail messages lasted.
- Unlistened Voicemails: The number of voicemails that have not been listened to by agents or supervisors.
- Follow-up Actions: Data on how many voicemails have been responded to or are pending follow-up.
- This widget is useful for ensuring that customers who leave voicemails are responded to in a timely manner and that no important messages are missed.
5. Abandoned Calls
Definition: Abandoned Calls refer to calls that are disconnected by the caller before being answered by an agent.
Details:
- The Abandoned Calls widget tracks:
- Total Abandoned Calls: The total number of calls that were abandoned by the caller before an agent could answer.
- Abandonment Rate: The percentage of total calls that are abandoned compared to the total number of incoming calls.
- Average Wait Time Before Abandonment: The average time a caller waits before hanging up.
- Peak Abandonment Times: The time periods during which call abandonment rates are the highest.
- This metric is important for identifying service gaps, improving call answering times, and reducing abandonment rates by adjusting staffing or improving self-service options.
6. Phantom Calls
-
Definition of Phantom Calls: Phantom calls are answered inbound calls that last for an extremely short duration, or below the default call time. These calls usually don’t involve meaningful interactions.
-
Phantom calls are those calls that have “n” and less seconds of talktime. Default n is 30s but can be changed from the KPI section of the admin dashboard.
-
Common Causes:
- Mis-dialed numbers: Customers might accidentally dial a number and quickly hang up.
- Automated Systems: Calls from robocalls or malfunctioning dialers that end almost immediately.
- Network Issues: Connectivity problems causing the call to disconnect right after it’s answered.
-
Impact on Call Analytics: Phantom calls can distort call center performance data, inflating the total number of inbound calls and affecting metrics like response time and customer engagement.
-
Ziwo's Call Duration Threshold: Ziwo allows users to set a minimum call duration (e.g., 30 seconds) to automatically filter out phantom calls, ensuring only meaningful interactions are counted.
-
Accurate Reporting: By excluding phantom calls, businesses get more accurate data for performance tracking, leading to better insights into call center effectiveness.
-
Improved Call Insights: Tracking and removing phantom calls helps businesses focus on real customer interactions, ensuring that their analytics reflect true engagement levels.
Each of these widgets in the Ziwo Live Dashboard plays a critical role in managing customer service operations efficiently. They provide real-time insights that enable call center managers to make quick decisions, optimize agent performance, and maintain a high level of service for customers. By closely monitoring these metrics, businesses can enhance customer satisfaction, reduce operational inefficiencies, and ensure smoother workflow management.
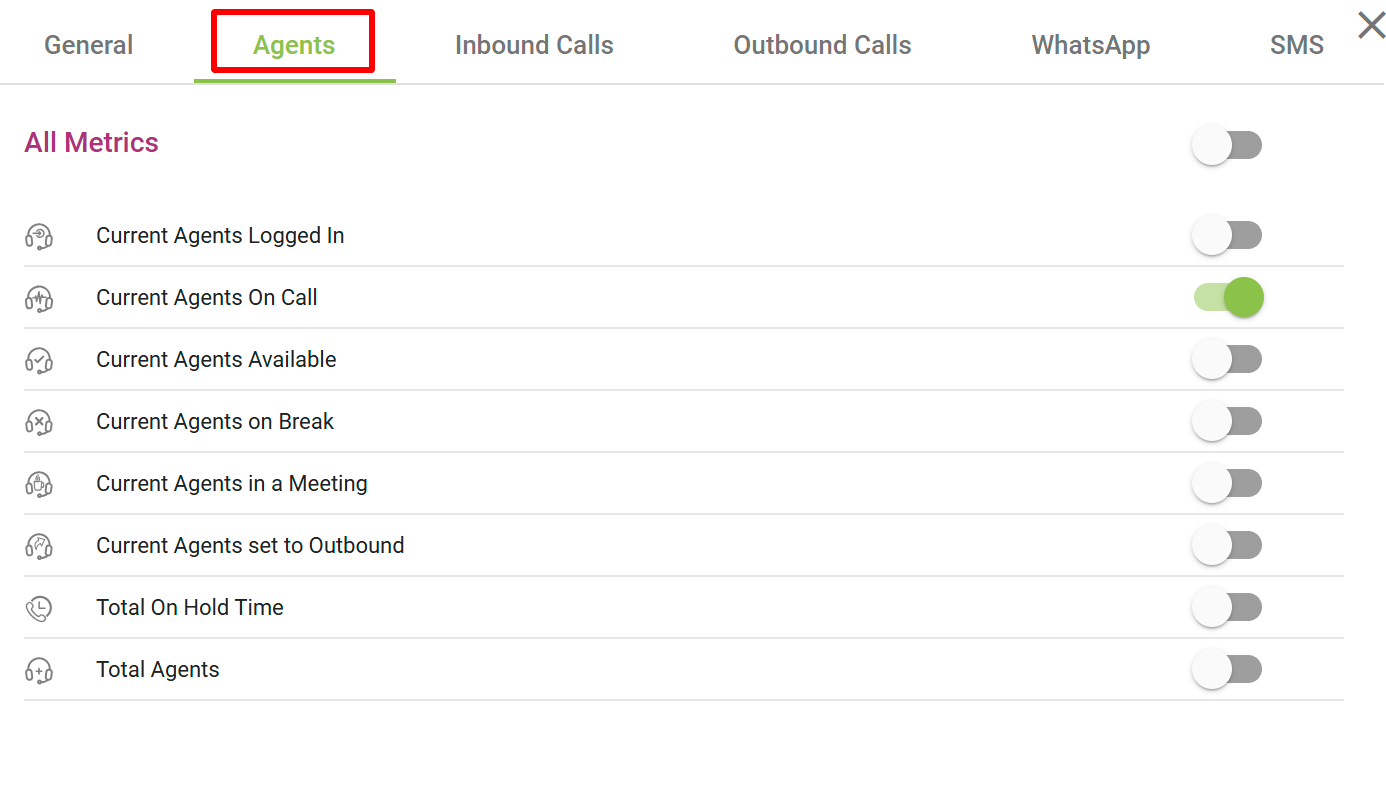
- Agents
Certainly! Here is the List for the Agents metrics in the Ziwo Live Dashboard:
| Metric | Definition | Calculation | Functionality and Options |
|---|---|---|---|
| Current Agents Logged In | The number of agents currently logged into the system and ready to take calls. | Total count of agents logged into the system, regardless of their current status (on call or idle). | - Real-Time: Continuously updated as agents log in/out. - Filters: Filter by teams or specific groups. |
| Current Agents On Call | The number of agents actively engaged in a call. | Total number of agents currently on active calls, marked as “on call” in the system. | - Real-Time: Updated as agents pick up/end calls. - Breakdown: Can show inbound and outbound calls separately. |
| Current Agents Available | The number of agents who are available to take new calls (not busy with calls, breaks, meetings, etc.). | Agents who are logged in and not in states such as on call, on break, in a meeting, or outbound. | - Real-Time Availability: Reflects agent status instantly. - Filters: Filter by teams or departments. |
| Current Agents on Break | The number of agents currently on a break and unavailable to handle calls. | Total number of agents marked as “on break” in the system. | - Custom Break Duration: Track duration of breaks. - Manual Updates: Update status for scheduled or unscheduled breaks. |
| Current Agents in a Meeting | The number of agents currently in meetings and not available to handle calls. | Total number of agents marked as “in a meeting” or “busy” in the system. | - Real-Time Updates: Tracks agents in meetings. - Meeting Duration: Track how long agents have been in meetings. |
| Current Agents Set to Outbound | The number of agents currently set to make outbound calls. | Total number of agents marked as “outbound” in the system, initiating calls to customers. | - Switching Status: Allows toggling between inbound and outbound. - Real-Time Updates: Tracks outbound activities. |
| Total On Hold Time | The total amount of time that all agents' calls have been on hold. | Sum of hold times across all active calls placed on hold, measured in seconds or minutes. | - Time Breakdown: Breakdown by individual agents, teams, or queues. - Peak Hold Time: Identifies the longest hold time. |
| Total Agents | The total number of agents currently logged into the system across all teams or departments. | Aggregate number of agents logged in, regardless of their current status (on call, available, on break, etc.). | - Grouped by Team/Department: Breakdown by specific teams. - Historical View: Analyzed over time to track workforce changes. |
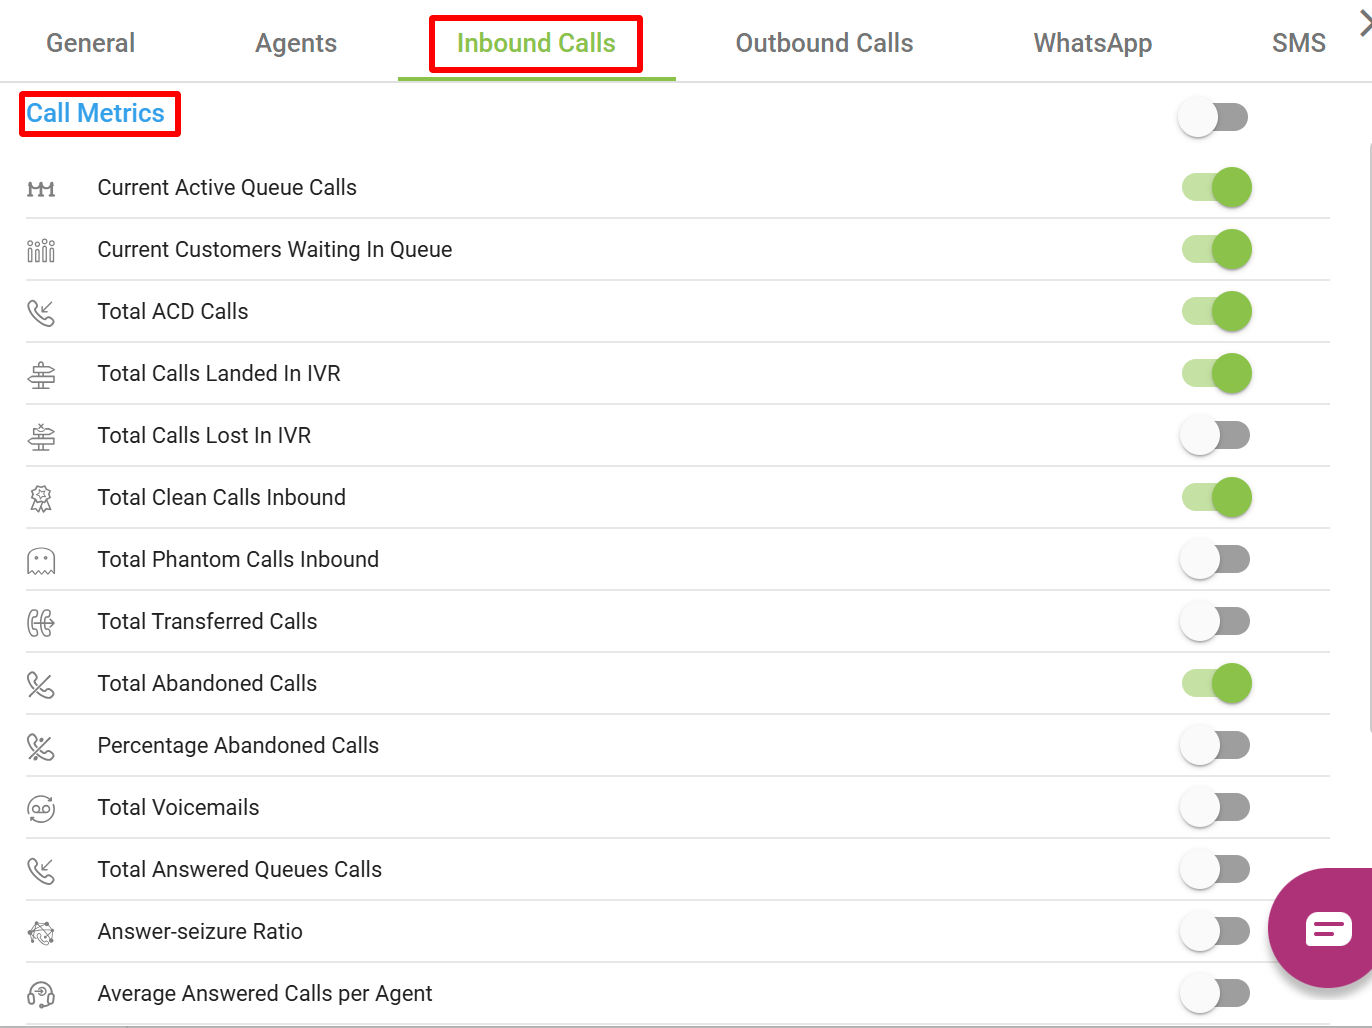
2. Inbound Calls
Certainly! Below is the List for the various Queue Metrics and Performance Metrics in the Ziwo Live Dashboard:
| Metric | Definition | Calculation | Options |
|---|---|---|---|
| Current Active Queue Calls | Shows the total current value of ongoing calls for all Queues | Σ Current ongoing calls for all Queues | - Real-Time: Updated dynamically as calls enter the queue. - Filtered by Queue: Track specific queues individually. |
| Current Customers Waiting in Queue | The number of customers currently waiting in the queue. | The count of customers in the queue, waiting for an agent to become available. | - Real-Time: Continuously updated. - Queue Segmentation: Filter by customer type or queue. |
| Total ACD Calls | Shows the number of calls received in all queues | Σ Calls received in all queues | - Real-Time: Tracks calls routed by ACD. - Periodical Reporting: Can be tracked over daily, weekly, or monthly. |
| Total Calls Landed In IVR | The total number of calls that entered the Interactive Voice Response (IVR) system. | Total calls that were processed by the IVR system, before being routed to agents or ending. | - Real-Time Updates: Track calls entering the IVR. - IVR Flow Analytics: Analyze which IVR paths were used most. |
| Total Calls Lost In IVR | The number of calls that were lost or abandoned during the IVR process, before reaching an agent. | Count of calls that were abandoned or disconnected while navigating the IVR system. | - IVR Analytics: Track lost calls by stage in the IVR. - Real-Time: Updates as calls are lost. |
| Total Clean Calls Inbound | Shows the number of answered inbound calls with a duration higher than a defined duration set by user | Σ Answered inbound calls with duration > user defined duration. | - Real-Time: Continually updates. - Clean Call Reporting: Analyze clean call metrics over different periods. |
| Total Phantom Calls Inbound | Shows the number of answered inbound calls with a duration lower than a defined duration set by user | Σ Answered inbound calls with duration < user defined duration | - Phantom Call Analysis: Track cause and frequency. - Real-Time Updates: Reflects phantom calls as they occur. |
| Total Transferred Calls | The number of calls transferred to another agent or department. | Count of calls that were handed off to another agent or team after being answered. | - Transfer Analytics: Track transfers by reason and type. - Real-Time Tracking: Updated as transfers occur. |
| Total Abandoned Calls | The number of calls that were abandoned by customers before being answered by an agent. | Count of calls that customers hung up before an agent could pick up. | - Abandonment Reporting: Track abandoned calls in real-time. - Abandonment Reasons: Analyze trends in abandonment. |
| Percentage Abandoned Calls | The percentage of abandoned calls out of the total calls received. | (Total Abandoned Calls / Total Calls Received) * 100 | - Real-Time Updates: Continuously updated. - Trends Analysis: Can track abandonment rates over different periods. |
| Total Voicemails | The total number of voicemails left by customers when an agent is unavailable. | Count of voicemails left in the system after customers reached voicemail. | - Real-Time Tracking: Updated when voicemails are left. - Voicemail Analytics: Track patterns of voicemail abandonment. |
| Total Answered Queue Calls | Shows the total value of answered Queue calls | Σ queue calls which were answered | - Answered Calls Reporting: Real-time updates. - Agent Performance: Track by individual agent or department. |
| Answer-Seizure Ratio | The ratio of calls answered by agents vs. the total number of calls that were attempted to be answered. | (Answered Calls / Total Call Attempts) | - Real-Time Metrics: Continuously updated. - Comparison: Compare answer-seizure across agents or departments. |
| Average Answered Calls per Agent | The average number of calls answered by each agent. | Total Answered Calls / Total Agents Available | - Real-Time Tracking: Updates as calls are answered. - Agent Performance Metrics: Track agent call-answering performance. |
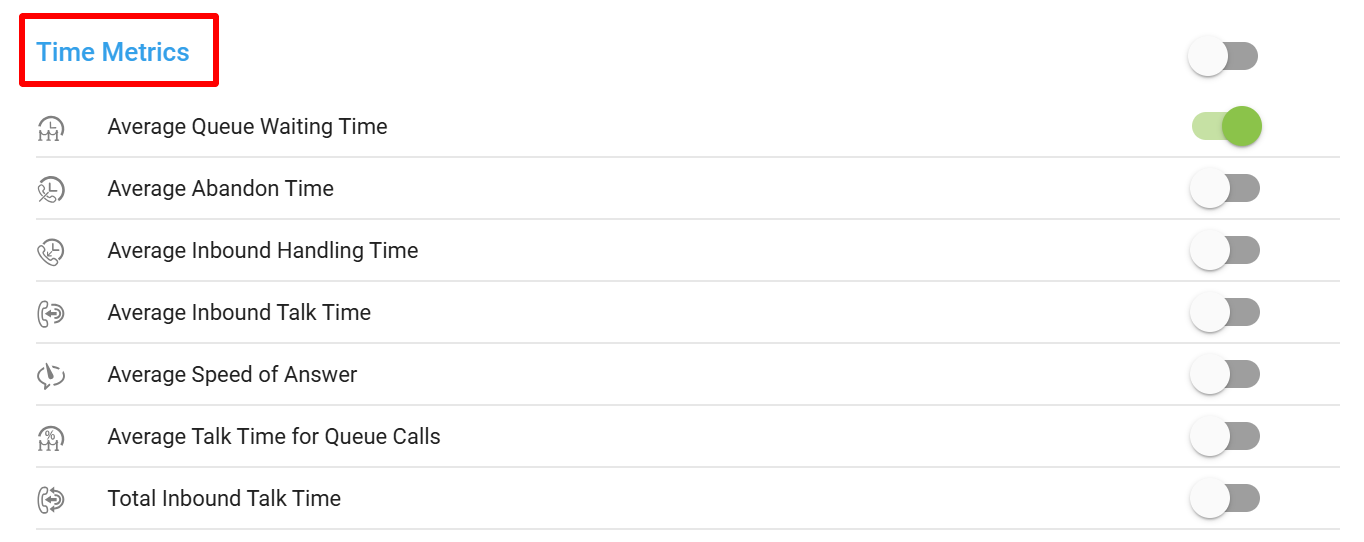
| Average Queue Waiting Time | The average time customers spend waiting in the queue before being answered by an agent. | Total Time Waiting in Queue / Total Number of Calls Answered from Queue | - Real-Time Updates: Reflects current waiting times. - Queue Management: Helps manage and reduce wait times. |
| Average Abandon Time | The average time customers stay in the queue before abandoning the call. | Total Abandon Time / Total Abandoned Calls | - Real-Time Metrics: Updates as abandonment times change. - Abandonment Insights: Provides insights into abandon patterns. |
| Average Inbound Handling Time | The average time agents take to handle inbound calls (from when the call is answered to when it is ended). | Total Inbound Handling Time / Total Answered Inbound Calls | - Real-Time Updates: Continuously updated. - Performance Monitoring: Track handling efficiency per agent. |
| Average Inbound Talk Time | The average duration of the talk time for inbound calls. | Total Inbound Talk Time / Total Answered Inbound Calls | - Real-Time Tracking: Continuously updated. - Talk Time Reporting: Track talk time trends across agents or periods. |
| Average Speed of Answer | The average time it takes for an agent to answer an inbound call after it enters the queue. | Total Time to Answer / Total Answered Calls | - Real-Time Updates: Reflects speed of answer as calls are answered. - Queue Optimization: Helps optimize agent response time. |
| Average Talk Time for Queue Calls | The average time agents spend talking to customers after receiving calls from the queue. | Total Talk Time for Queue Calls / Total Answered Queue Calls | - Real-Time Metrics: Updated dynamically. - Queue Talk Time Insights: Provides details of talk time specifically for queue calls. |
| Total Inbound Talk Time | The total amount of time agents have spent talking to customers on inbound calls. | Total Talk Time for All Inbound Calls | - Real-Time Tracking: Continuously updated. - Talk Time Reporting: Total time accumulated for inbound calls. |
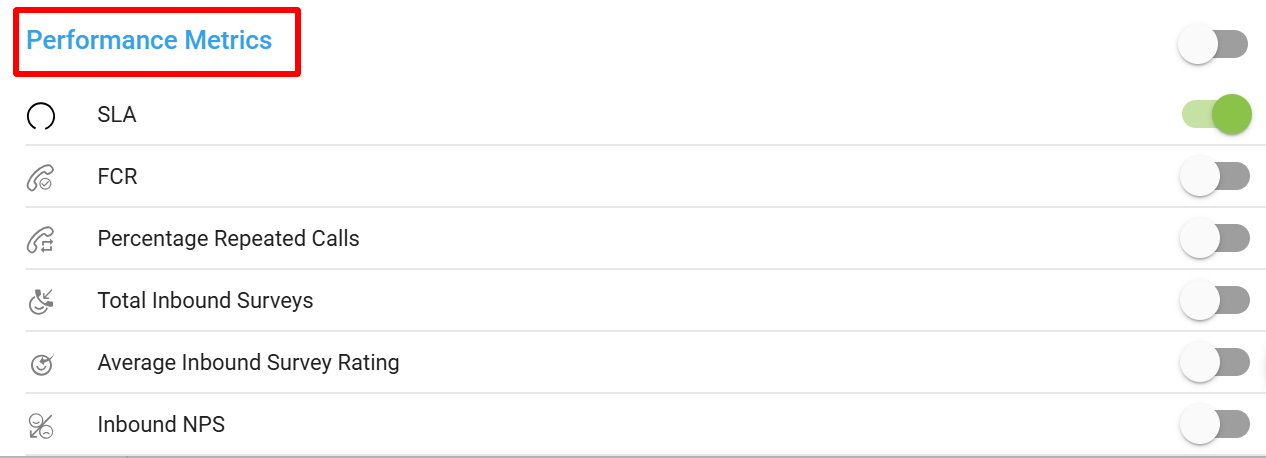
Performance Metrics
| Metric | Definition | Calculation | Options |
|---|---|---|---|
| SLA (Service Level Agreement) | The percentage of calls answered within a predefined time frame (e.g., 80% of calls answered within 20 seconds). | (Number of Calls Answered Within SLA / Total Calls Answered) * 100 | - Real-Time: Continuous updates. - SLA Tracking: Analyze performance against agreed SLA thresholds. |
| FCR (First Call Resolution) | The percentage of calls that are resolved during the first interaction, without requiring follow-up. | (Number of Calls Resolved on First Interaction / Total Calls Answered) * 100 | - Real-Time: Continuously updated. - Resolution Tracking: Provides detailed insights into FCR rates. |
| Percentage Repeated Calls | The percentage of calls that are repeat calls from the same customer within a specified time period. | (Repeated Calls / Total Calls) * 100 | - Real-Time Metrics: Track repeat calls dynamically. - Repeat Call Insights: Helps identify patterns of repeat interactions. |
| Total Inbound Surveys | The total number of surveys completed by customers after an inbound interaction. | Count of completed inbound surveys. | - Real-Time Updates: Tracks surveys completed in real-time. - Survey Reporting: Provides insights into survey response trends. |
| Average Inbound Survey Rating | The average rating given by customers who completed an inbound survey. | Total Survey Ratings / Total Number of Surveys | - Real-Time Updates: Tracks survey ratings as they come in. - Customer Feedback Analysis: Analyzes average customer ratings. |
| Inbound NPS | The Net Promoter Score (NPS) derived from inbound customer surveys, indicating overall customer satisfaction. | (Promoters - Detractors) / Total Survey Responses * 100 | - Real-Time Metrics: Continuously updates. - NPS Insights: Helps gauge customer loyalty and satisfaction. |
These metrics help provide a comprehensive view of both queue performance and agent performance, enabling supervisors to monitor real-time activities, improve efficiency, and assess customer satisfaction in the call center environment.
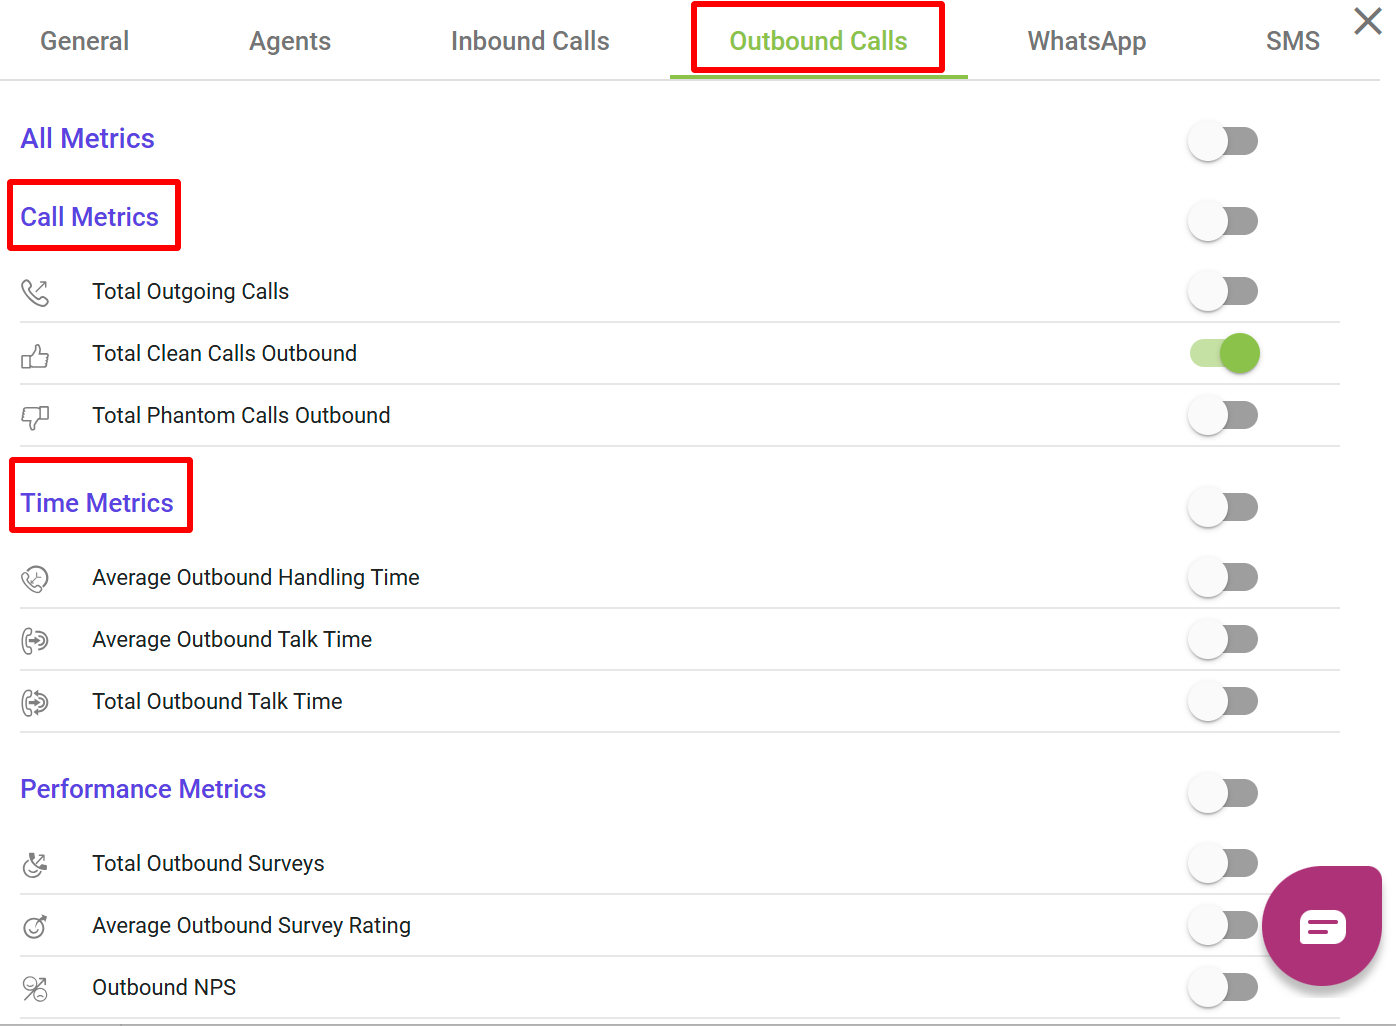
3. Outbound Calls
Here is the List for the Call Metrics and Performance Metrics related to outbound calls, organized in a for the Ziwo Live Dashboard:
Call Metrics
| Metric | Definition | Calculation | Options |
|---|---|---|---|
| Total Outgoing Calls | The total number of calls made by agents or the system for outbound purposes. | Count of all calls initiated by agents or automated systems for outbound purposes. | - Real-Time Tracking: Continuously updates. - Outbound Call Segmentation: Filter by type (manual vs automated). |
| Total Clean Calls Outbound | Shows the number of outbound calls with a duration higher than a defined duration set by user | Σ Outbound calls (call duration > user defined duration) | - Real-Time Updates: Reflects clean calls as they are made. - Clean Call Analytics: Tracks performance over time. |
| Total Phantom Calls Outbound | Shows the number of outbound calls with a duration lower than a defined duration set by user | Σ outbound calls (call duration < user defined duration) | - Real-Time Tracking: Updated as phantom calls occur. - Phantom Call Insights: Provides insights into the cause and frequency of phantom calls. |
Time Metrics
Metric | Definition | Calculation | Options |
|---|---|---|---|
Average Outbound Handling Time | Average duration of an outbound call, typically measured from the agent’'s initiation of the call and including any hold time, talk time and wrap up time | Average Outbound Handling time (AHT)= (Total talk time+ Total hold time+ total wrap up time) / Total number of answered calls |
|
Average Outbound Talk Time | Shows the average total outbound talk time | Total Outbound Talk Time / Total Outbound Calls Answered |
|
Total Outbound Talk Time | The total amount of time agents spend talking to customers during outbound calls. | Σ Outbound calls talk time/Total answered Outbound calls |
|
Performance Metrics
| Metric | Definition | Calculation | Options |
|---|---|---|---|
| Total Outbound Surveys | The total number of surveys completed by customers after an outbound interaction. | Count of completed outbound surveys by customers after being contacted by an agent. | - Real-Time Tracking: Continually updated. - Survey Analysis: Provides insights into customer satisfaction after outbound calls. |
| Average Outbound Survey Rating | The average rating given by customers who completed an outbound survey. | Total Survey Ratings / Total Number of Outbound Surveys Completed | - Real-Time Updates: Track average ratings. - Survey Feedback Insights: Helps analyze satisfaction trends. |
| Outbound NPS (Net Promoter Score) | The Net Promoter Score (NPS) derived from outbound customer surveys, indicating overall customer satisfaction. | (Promoters - Detractors) / Total Survey Responses * 100 | - Real-Time Metrics: Updated dynamically as surveys are completed. - NPS Insights: Track customer loyalty and satisfaction. |
These Outbound Call Metrics and Performance Metrics provide a complete view of the call center’s outbound activities, allowing for effective monitoring of call success, agent efficiency, and customer satisfaction. By tracking these metrics in real-time, organizations can optimize outbound campaigns, reduce inefficiencies, and better assess the effectiveness of their outbound outreach strategies.
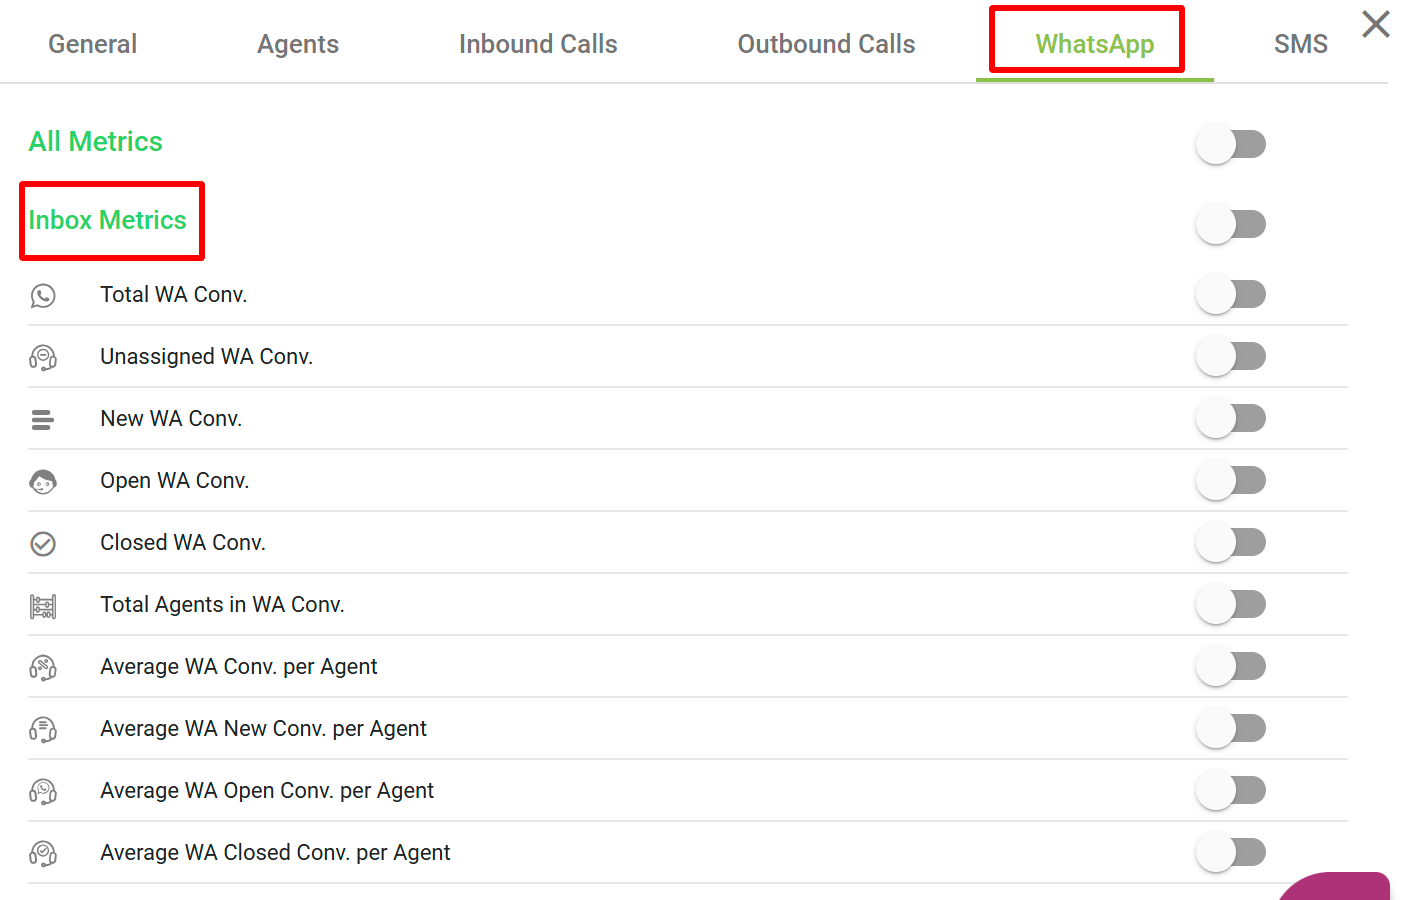
4. Whatsapp
Here’s a detailed list for Inbox Metrics and Speed of Response Metrics in the Ziwo Live Dashboard, presented in a tabular format:
Inbox Metrics
| Metric | Definition | Calculation | Options |
|---|---|---|---|
| Total WA Conv. (Total WhatsApp Conversations) | The total number of WhatsApp conversations in the inbox. | Count of all WhatsApp conversations that have entered the inbox. | - Real-Time Updates: Continuously updates as new conversations are initiated. - Segmentation: Can be filtered by active or archived conversations. |
| Unassigned WA Conv. (Unassigned WhatsApp Conversations) | The total number of WhatsApp conversations that have not been assigned to any agent. | Count of conversations in the inbox that remain unassigned to agents. | - Real-Time Tracking: Updated as conversations are unassigned. - Assignment Workflow: Filter based on the assignment status. |
| New WA Conv. (New WhatsApp Conversations) | The total number of new WhatsApp conversations that have been initiated. | Count of conversations that are marked as new when initiated by customers. | - Real-Time Updates: Continuously updated. - New Conversation Insights: Monitor new incoming conversations. |
| Open WA Conv. (Open WhatsApp Conversations) | The total number of WhatsApp conversations that are currently open and have not been resolved yet. | Count of conversations that are marked as open or in-progress. | - Real-Time Tracking: Updated as conversations are opened. - Progress Tracking: Filter based on open status. |
| Closed WA Conv. (Closed WhatsApp Conversations) | The total number of WhatsApp conversations that have been resolved and closed. | Count of conversations that have been marked as closed, meaning the interaction has been resolved. | - Real-Time Updates: Continuously updated. - Closed Conversation Insights: Track closed conversations for analysis. |
| Total Agents in WA Conv. (Total Agents Handling WhatsApp Conversations) | The total number of agents currently assigned to handle WhatsApp conversations. | Count of active agents involved in WhatsApp conversations. | - Real-Time Tracking: Updated as agents are assigned to conversations. - Agent Monitoring: Track performance by agent. |
| Average WA Conv. per Agent | The average number of WhatsApp conversations handled by each agent. | Total WhatsApp Conversations / Total Agents Handling Conversations | - Real-Time Updates: Continuously updates. - Performance Insights: Monitor workload distribution per agent. |
| Average WA New Conv. per Agent | The average number of new WhatsApp conversations assigned to each agent. | Total New WhatsApp Conversations / Total Agents Handling New Conversations | - Real-Time Tracking: Updated as new conversations are assigned. - Agent Performance: Measure distribution of new conversations. |
| Average WA Open Conv. per Agent | The average number of open WhatsApp conversations handled by each agent. | Total Open WhatsApp Conversations / Total Agents Handling Open Conversations | - Real-Time Updates: Continuously updates. - Agent Efficiency: Track how many open conversations are being handled per agent. |
| Average WA Closed Conv. per Agent | The average number of closed WhatsApp conversations completed by each agent. | Total Closed WhatsApp Conversations / Total Agents Handling Closed Conversations | - Real-Time Tracking: Updated as closed conversations increase. - Resolution Efficiency: Monitor closed conversation distribution. |
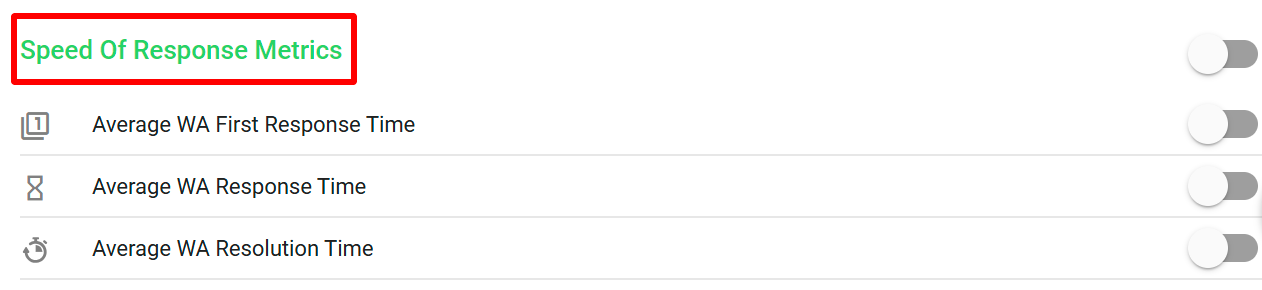
Speed of Response Metrics
| Metric | Definition | Calculation | Options |
|---|---|---|---|
| Average WA First Response Time | The average time taken by agents to respond to a new incoming WhatsApp conversation. | Total Time to First Response for New Conversations / Total Number of New Conversations | - Real-Time Tracking: Continuously updates. - Response Time Insights: Helps optimize response speed for better customer experience. |
| Average WA Response Time | The average time agents take to respond to all WhatsApp conversations (whether new, open, or ongoing). | Total Time to Response for All Conversations / Total Number of Conversations Answered | - Real-Time Metrics: Continuously updates. - Overall Response Efficiency: Track overall response times per agent or team. |
| Average WA Resolution Time | The average time taken by agents to resolve and close a WhatsApp conversation after the first response. | Total Time to Resolution for Closed Conversations / Total Number of Closed Conversations | - Real-Time Tracking: Continuously updated. - Resolution Time Insights: Helps in improving the efficiency of closing conversations. |
These Inbox Metrics and Speed of Response Metrics are crucial for monitoring agent efficiency, conversation handling, and customer satisfaction with WhatsApp communication. By leveraging real-time tracking and segmentation, businesses can optimize their response strategies, improve agent performance, and enhance customer experience.
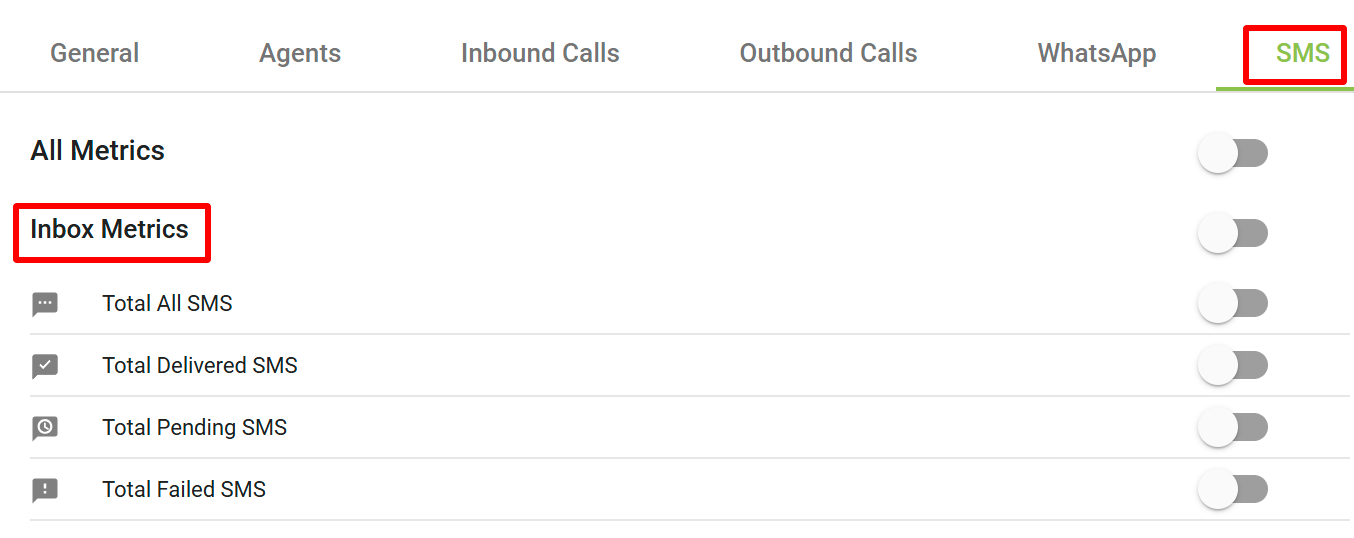
5. SMS
Here’s a detailed list for Inbox Metrics related to SMS in the Ziwo Live Dashboard, presented in a tabular format:
Inbox SMS Metrics
| Metric | Definition | Calculation | Options |
|---|---|---|---|
| Total All SMS | The total number of SMS messages that have been processed, whether successfully delivered or not. | Count of all SMS messages sent and processed through the system, including delivered, pending, and failed messages. | - Real-Time Updates: Continuously updated as SMS messages are processed. - Filter by Status: Segmentation options for delivered, pending, or failed messages. |
| Total Delivered SMS | The total number of SMS messages that were successfully delivered to the recipients. | Count of SMS messages that were successfully delivered and received by the intended recipient. | - Real-Time Tracking: Updated as SMS messages are successfully delivered. - Delivery Success Insights: Analyze successful deliveries over time. |
| Total Pending SMS | The total number of SMS messages that are currently in the pending state and have not been delivered yet. | Count of SMS messages that are waiting for delivery but have not been processed or delivered yet. | - Real-Time Updates: Continuously updated. - Pending SMS Monitoring: Track and investigate delivery delays. |
| Total Failed SMS | The total number of SMS messages that failed to be delivered to the intended recipients. | Count of SMS messages that failed during the delivery process (e.g., due to invalid phone numbers or network issues). | - Real-Time Tracking: Continuously updated. - Failure Insights: Helps in identifying delivery failure patterns and resolving issues. |
These SMS Inbox Metrics allow you to track and manage SMS communication effectiveness, ensuring timely deliveries and identifying potential issues in SMS message delivery. Real-time updates and segmentation help in better monitoring and resolution of pending or failed messages.
.